


In Singapore’s real estate market, the island is divided into three main regions that are crucial for understanding property classifications and market trends: the Core Central Region (CCR), the Rest of Central Region (RCR), and the Outside Central Region (OCR). Here, we list down all the Singapore districts that comprise each region.
Singapore District Map: Breaking Down CCR, RCR, OCR
Core Central Region (CCR)
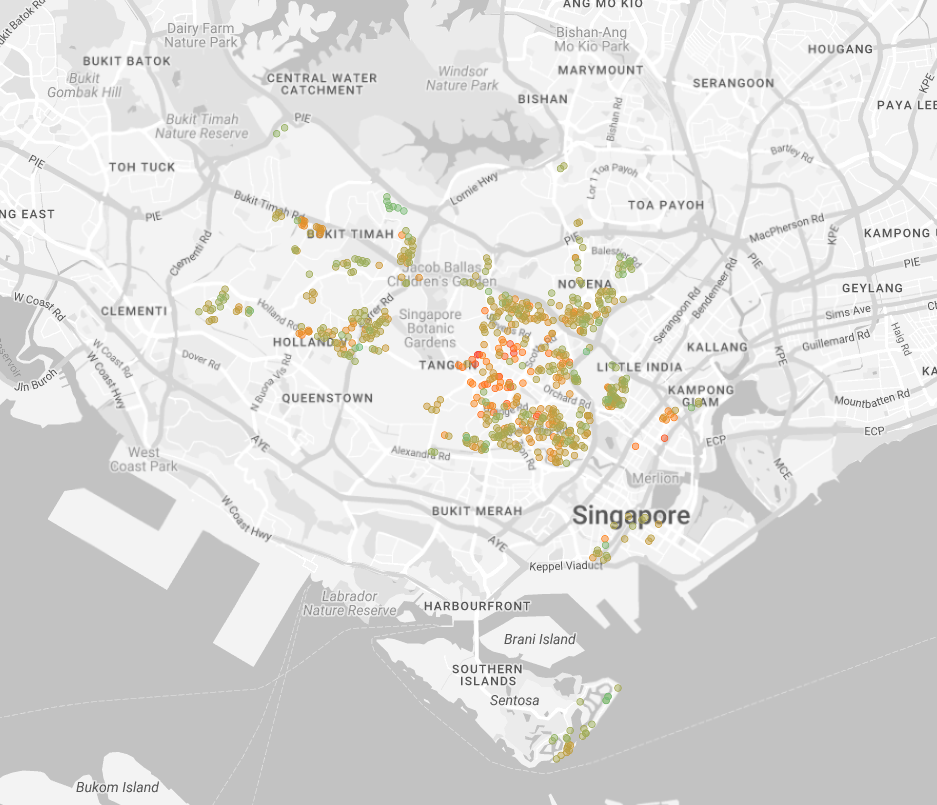
A map depicting 2023 property transactions in the CCR.
This area includes the central and most prime residential districts of Singapore, such as Districts 9, 10, 11 (better known as the central area), Downtown Core, and Sentosa. Properties in the CCR are highly sought after due to their prime locations, proximity to the Central Business District (CBD), luxury amenities, and prestigious addresses. The CCR is popular among high-net-worth individuals, expats, and investors looking for premium residential properties.
Do you live in the Core Central Region (CCR)?
| Singapore Postal District | Area |
|---|---|
| Prime Central Area | |
| District 9 (Central – Orchard) | Orchard, Cairnhill, River Valley |
| District 10 (Central – Near Orchard) | Bukit Timah, Holland Road, Tanglin |
| District 11 (Central – Near Orchard) | Newton, Novena |
| Downtown Core | |
| Part of District 1 (Business District) | Raffles Place, Cecil, Marina, People’s Park |
| Part of District 2 (Business District) | Anson, Tanjong Pagar |
| District 6 (City/ Business District) | City Hall, High Street |
| Part of District 7 (City) | Beach Road, Bencoolen Road, Bugis, Rochor |
| Sentosa | |
| District 4 (South) | Sentosa, Harbourfront |
Should you sell your CCR property?
If you own a condo unit at any of these D10 new launch projects — 19 Nassim, Grange 1886, and Park Nova — or Midtown Modern at D07, you can consider selling it in 2024 without paying Seller’s Stamp Duty (SSD).
CCR condos to be SSD-free from 2024
| Project Name | District | Total No. of Units |
|---|---|---|
| 19 Nassim | 10 | 101 |
| Grange 1886 | 10 | 60 |
| Park Nova | 10 | 54 |
| Midtown Modern | 7 | 200 |
In 2023, there were over 17,600 private property transactions in the CCR, a majority of which were resale transactions. Here’s a general overview of CCR property prices at a glance:
| Maximum Sale Price | $75,000,000 |
| Minimum Sale Price | $550,000 |
| Average Sale Price | $2,924,518 |
| Average $ PSF | $2,303 |
| Average SQ FT | 1,276 |
Central area condo prices from 2023 transactions
Here are the top 10 new launch condo projects in the central area that were transacted in the past year, ranked from the highest price per square foot.
| Project Name | $ PSF |
|---|---|
| Les Maisons Nassim | $5,635 |
| Eden | $5,165 |
| Park Nova | $4,859 |
| Sculptura Ardmore | $4,444 |
| Le Nouvel Ardmore | $4,324 |
| Skyline @ Orchard Boulevard | $4,200 |
| The Marq On Paterson Hill | $4,082 |
| Boulevard Vue | $4,052 |
| Klimt Cairnhill | $3,839 |
| The Ritz Carlton Residences | $3,746 |
Downtown Core condo prices from 2023 transactions
Here are the top 10 new launch condo projects in Downtown Core that were transacted in the past year, ranked from the highest price per square foot.
| Project Name | $ PSF |
|---|---|
| Wallich Residence | $3,427 |
| South Beach Residences | $3,365 |
| Eden Residences Capitol | $3,307 |
| Midtown Bay | $2,969 |
| Midtown Modern | $2,776 |
| One Bernam | $2,519 |
| The M | $2,513 |
| Robinson Suites | $2,469 |
| Marina One Residences | $2,447 |
| Marina Bay Residences | $2,306 |
Sentosa condo prices from 2023 transactions
Here are the top 10 new launch condo projects in Sentosa that were transacted in the past year, ranked from the highest price per square foot.
| Project Name | $ PSF |
|---|---|
| Seven Palms Sentosa | $2,843 |
| Cape Royale | $2,196 |
| Seascape | $2,011 |
| Marina Collection | $1,784 |
| The Oceanfront @ Sentosa Cove | $1,613 |
| The Coast At Sentosa Cove | $1,563 |
| Turquoise | $1,472 |
| The Azure | $1,450 |
| The Berth By The Cove | $1,365 |
Should you buy a CCR property?
While central region properties are known to be priced higher than those in the OCR and RCR, the truth is that there are always units for sale that are affordable for the average buyer. Here are 10 freehold condo projects at lower than $1,500 PSF.
10 freehold CCR condos lower than $1,500 PSF
Leasehold properties tend to depreciate in value over time, so we compiled a list of freehold condos in the CCR for you to consider instead, in a price range lower than $2,000 PSF, which has become the market norm today.
| Project Name | $ PSF | Sales Volume |
|---|---|---|
| Cavenagh Gardens | $1,290.24 | 34 |
| Orchard Towers | $1,371.60 | 10 |
| The Axis | $1,395.44 | 16 |
| Adam Park Condominium | $1,396.11 | 28 |
| Mandale Heights | $1,403.13 | 23 |
| The Ansley | $1,431.10 | 20 |
| Parc Mackenzie | $1,437.14 | 14 |
| Jervois Regency | $1,448.55 | 11 |
| Parc Centennial | $1,452.07 | 27 |
| Thomson 800 | $1,459.84 | 51 |
Should you rent out your CCR property?
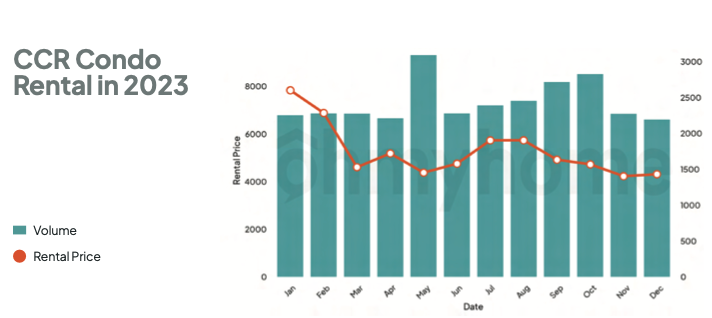
The number of rental transactions in the CCR was on a downward trend throughout 2023, starting from a high in January. November and December recorded the lowest transaction volume at 1,407 and 1,434 rentals, respectively.
There was moderate growth in rental prices from January to October, though this did not persist. Rental prices slid to $6,630 in December following a spike in May where prices rose sharply to $9,334 from the previous month.
Rest of Central Region (RCR)
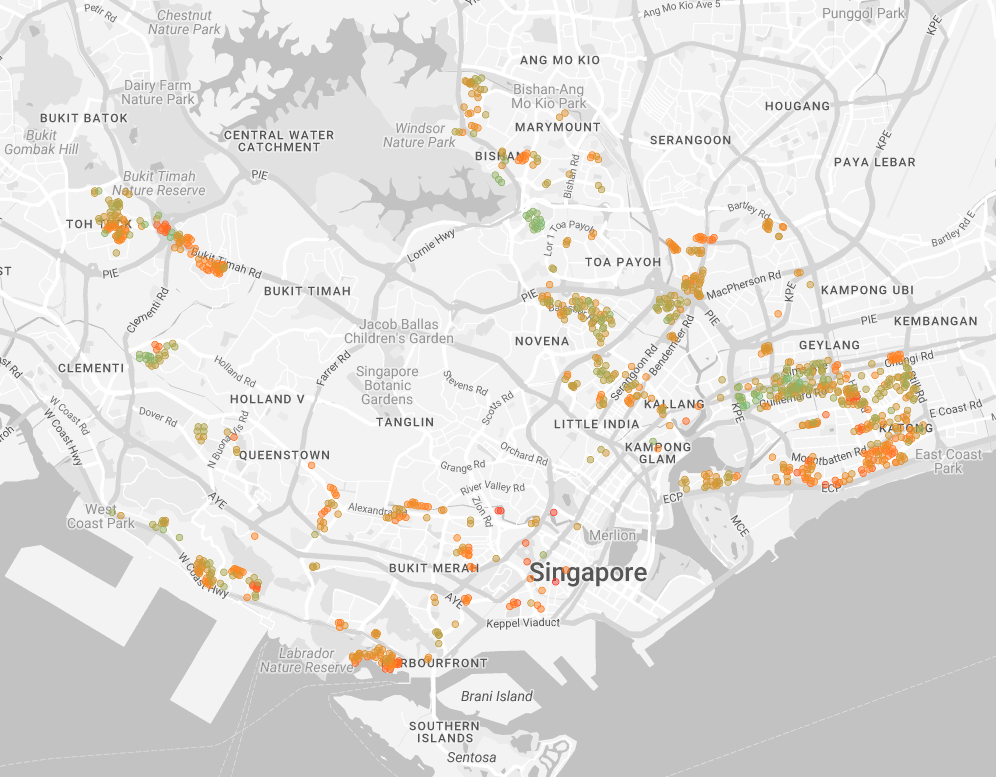
A map depicting 2023 property transactions in the RCR.
Surrounding the CCR, the RCR includes areas that are within the central region but are not classified as core central. This includes locations like Bukit Merah, Geylang, Kallang, and Queenstown. Properties in the RCR offer a balance between proximity to the city center and more affordable prices compared to the CCR. The RCR is attractive to buyers and investors looking for properties that are close to the city but at a lower entry price point.
Do you live in the Rest of Central Region (RCR)?
| Singapore Postal District | Area |
|---|---|
| Part of District 1 (City – Business District) | Marina South |
| Part of District 2 (City – Business District) | Chinatown |
| District 3 (Central South) | Queenstown, Tiong Bahru |
| Part of District 4 (South) | Telok Blangah, Harbourfront |
| Part of District 5 (South West) | Pasir Panjang, Clementi New Town |
| Part of District 6 (City – Business District) | City Hall, High Street |
| Part of District 7 (City) | Middle Road, Golden Mile |
| District 8 (Central) | Little India, Farrer Park, Serangoon Road |
| District 12 (Central) | Balestier, Toa Payoh, Serangoon |
| Part of District 13 (Central East) | Macpherson, Braddell |
| Part of District 14 (Central East) | Geylang, Eunos |
| Part of District 15 (East Coast) | Katong, Joo Chiat, Amber Road |
| Part of District 19 (North East) | Paya Lebar |
| District 20 (Central North) | Bishan, Ang Mo Kio |
| District 21 (Central West) | Upper Bukit Timah, Clementi Park, Ulu Pandan |
| District 23 (North West) | Bukit Batok, Bukit Panjang, Choa Chu Kang |
Should you sell your RCR property?
If you own a condo unit at any of these new launch projects in the RCR, you can consider selling it in 2024 without paying SSD.
RCR condos to be SSD-free from 2024
| Project Name | District | Total No. of Units |
|---|---|---|
| Midtown Modern | 7 | 200 |
| Liv @ MB | 15 | 298 |
| Meyer Mansion | 15 | 200 |
| Forett at Bukit Timah | 21 | 633 |
| Ki Residences at Brookvale | 21 | 660 |
In 2023, there were over 35,800 private property transactions in the RCR, a majority of which were resale transactions. Here’s a general overview of RCR property prices at a glance:
RCR condo prices from 2023 transactions
| Maximum Sale Price | $48,000,000 |
| Minimum Sale Price | $445,000 |
| Average Sale Price | $1,651,070 |
| Average $ PSF | $1,748 |
| Average SQ FT | 975 |
Should you buy an RCR property?
10 freehold RCR condos lower than $1,500 PSF
Leasehold properties tend to depreciate in value over time, so we compiled a list of freehold condos in the RCR for you to consider instead, in a price range lower than $2,000 PSF, which has become the market norm today.
| Project Name | $ PSF | Sales Volume |
|---|---|---|
| Signature Park | $1,331.49 | 104 |
| Pandan Valley | $1,248.07 | 72 |
| The Sunny Spring | $1,167.90 | 61 |
| Park Natura | $1,123.70 | 46 |
| The Beverly | $1,146.21 | 39 |
| Le Crescendo | $1,247.15 | 39 |
| Casa Fortuna | $1,274.83 | 36 |
| The Verve | $1,339.14 | 35 |
| Atrium Residences | $1,041.23 | 31 |
| Tivoli Grande | $1,230.23 | 31 |
Should you rent out your RCR property?
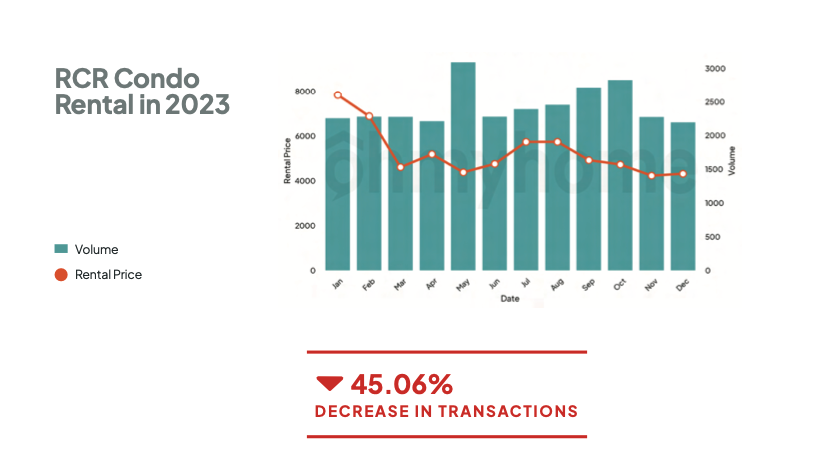
The condo rental market in the RCR was moderately stable throughout the year, with prices exhibiting a slight upward trend from January to October, despite the fluctuations in transaction volume. RCR rental prices saw a significant 39.68% surge, recording an overall 22.84% increase in 2023. Rental transactions fell from January to March, and continued to fluctuate in the remaining months. Overall, there was a 45.06% fall in RCR rentals.
Outside Central Region (OCR)
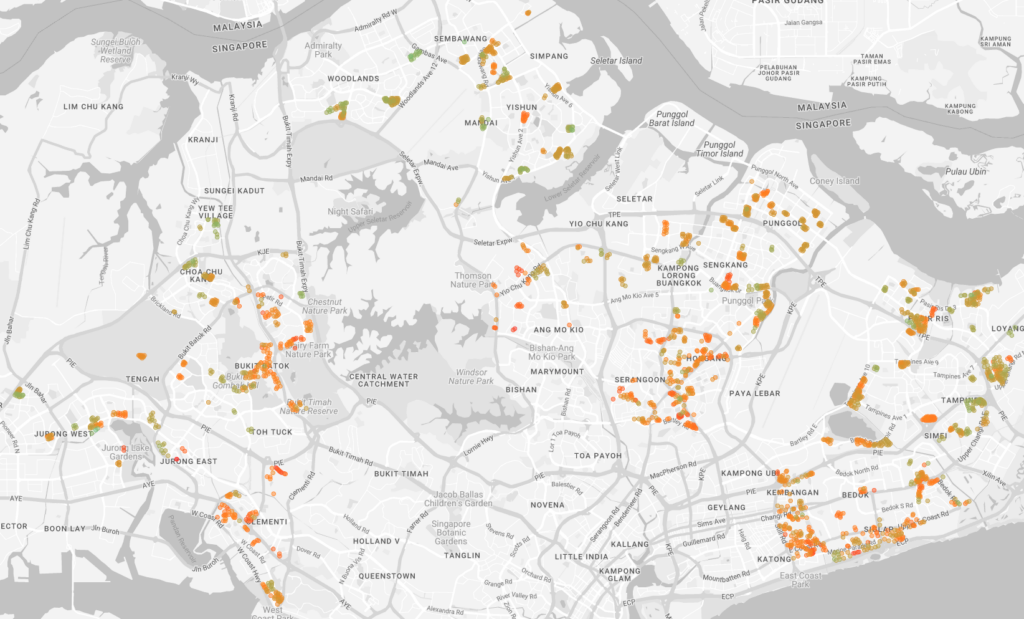
A map depicting 2023 property transactions in the OCR.
This region encompasses the suburban areas and is the largest of the three regions. It includes towns like Bedok, Bukit Batok, Hougang, and Tampines. The OCR is known for its more affordable residential options, comprehensive amenities, and good connectivity to the rest of the island. Properties in the OCR are popular among a wide range of buyers, including first-time homeowners and those looking for more spacious living options at a lower cost.
Do you live in the Outside Central Region (OCR)?
| Singapore Postal District | Area |
|---|---|
| Part of District 5 | Clementi, West Coast |
| District 13 | Bradell |
| Part of District 14 | Kemabangan, Kaki Bukit |
| Part of District 15 | Telok Kurau, Siglap, Frankel |
| District 16 | Bedok, Upper East Coast, Bayshore, Tanah Merah, Upper Changi |
| District 17 | Flora Drive, Loyang, Changi |
| District 18 | Tampines, Pasir Ris |
| District 19 | Punggol, Sengkang, Hougang, Kovan, Serangoon, Lorong Ah Soo |
| Part of District 20 | Ang Mo Kio |
| District 21 | Upper Bukit Timah, Ulu Pandan, Clementi Park |
| District 22 | Jurong East, Jurong West, Boon Lay |
| District 23 | Hillview, Bukit Panjang, Bukit Batok, Choa Chu Kang |
| District 24 | Kranji, Lim Chu Kang, Sungei Gedong, Tengah |
| District 25 | Woodlands, Admiralty |
| District 26 | Lentor, Springleaf, Mandai |
| District 27 | Yishun, Sembawang |
| District 28 | Seletar, Seletar Hill, Sengkang West |
Should you sell your OCR property?
If you own a condo unit at any of these new launch projects in the OCR, you can consider selling it in 2024 without paying SSD.
OCR condos to be SSD-free from 2024
| Project Name | District | Total No. of Units |
|---|---|---|
| Liv @ MB | 15 | 298 |
| Meyer Mansion | 15 | 200 |
| Forett at Bukit Timah | 21 | 633 |
| Ki Residences at Brookvale | 21 | 660 |
In 2023, there were over 59,600 private property transactions in the OCR, a majority of which were resale transactions. Here’s a general overview of OCR property prices at a glance:
OCR condo prices from 2023 transactions
| Maximum Sale Price | $6,800,000 |
| Minimum Sale Price | $376,000 |
| Average Sale Price | $1,234,306 |
| Average $ PSF | $1,255 |
| Average SQ FT | 1,027 |
Should you buy an OCR property?
10 freehold OCR condos lower than $1,500 PSF
Leasehold properties tend to depreciate in value over time, so we compiled a list of freehold condos in the OCR for you to consider instead, in a price range lower than $2,000 PSF, which has become the market norm today.
| Project Name | $ PSF | Volume |
|---|---|---|
| Vacanza @ East | $1,217.86 | 132 |
| The Parc Condominium | $1,348.39 | 113 |
| Flamingo Valley | $1,472.01 | 103 |
| Meadows @ Peirce | $1,199.88 | 101 |
| Clementi Park | $1,219.15 | 68 |
| Parc Palais | $1,206.57 | 68 |
| The Infiniti | $1,164.50 | 62 |
| The Gale | $1,001.40 | 62 |
| Sunhaven | $1,016.67 | 61 |
| Glendale Park | $1,297.90 | 60 |
Should you rent out your OCR property?
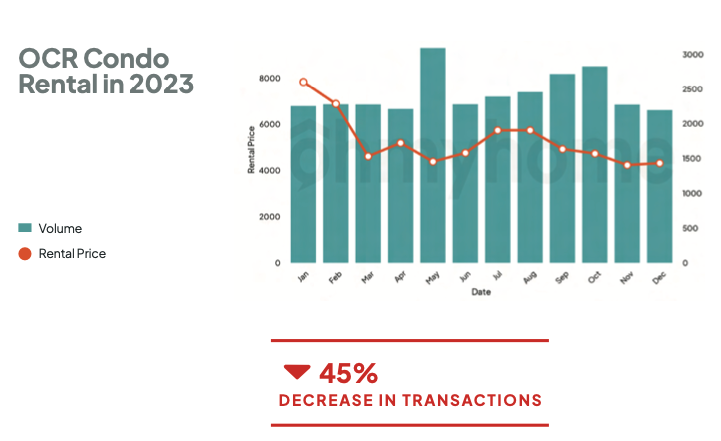
There has been a consistent downward trend in both monthly rental prices and transaction volume for OCR condos throughout 2023. Rental prices fell from $6,807 in January to $6,630 in December, reflecting a 2.6% downturn by the end of the year. The number of transactions also dropped by 45% from 2,604 rentals in January to 1,434 in December.
Average PSF price growth of private projects in the past 10 years: CCR vs OCR vs RCR
Looking at the average PSF prices of private properties in the CCR, OCR, and RCR, we can see a steady growth in prices for all three regions.

However, property prices in the CCR have grown at a faster pace than in the OCR and RCR. This also means more fluctuations in the market trend, owing to the constant shifts in demand and supply in prime central properties. As property prices grow at a faster pace, buyers tend to move to the city-fringe, which results in rising prices in those areas. And so it goes for RCR properties.
What’s interesting is that prices have risen significantly in the last two years, from 2022 to 2024, when Singapore opened its borders following nationwide restrictions and heightened alert measures at the height of the pandemic.
Considering to buy, sell, rent properties in CCR, OCR, or RCR?
Drop us a message on WhatsApp to speak with any of our property agents or ask us a question on the Live Chat at the bottom, right-hand corner of the screen. We’ll respond to you in less than 3 minutes — promise.
Stay updated on your condo valuation, potential cash proceeds, and past transactions in your area on Homer AI!